
Explainable AI : Class Activation Mapping
The Foundations of Explainable AI for Convolutional Networks

What is Class Activation Mapping ?
Similar to saliency maps introduced earlier, Class Activation Mapping (CAM)[1] is an explainable AI technique used to interpret how models make decisions in image classification tasks. CAM creates heatmaps that indicate which regions of an image had the greatest influence on the model’s classification outcome.
Principle of a Convolutional Network
CAM can be applied when a convolutional neural network (CNN) is used for classification. A CNN relies on specialized layers, called convolutional and pooling layers, which progressively reduce the dimensionality of the input while extracting different sets of meaningful characteristics or features. To achieve this, instead of producing a single transformed image, CNNs generate multiple matrices known called activation maps.
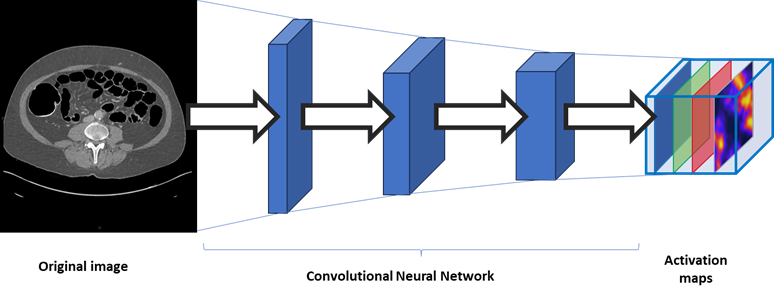
These activation maps are smaller than the original image, with each map capturing a different aspect of the input. Importantly, elements are computed based on a specific region of the input, known as the receptive field, and the activation maps preserve spatial relationships: the top-left element of an activation map is based to the top-left region of the image, the element to its right corresponds to a region shifted right, and so on. Each activation map can therefore be understood as a spatial summary of one characteristic or feature detected in the image.
Finally, these activation maps can be passed through standard neural network layers, which use the extracted features to produce the final classification outcome.
Computing Class Activation Mapping
For CAM to be applied, the layers following the convolutional layers must meet two conditions:
Global average pooling: Each activation map is first reduced to a single value by taking the average of all its elements. These averages are denoted A1,A2,…,An
Single fully connected layer: The pooled averages are passed through only one fully connected layer, where each neuron receives all the averages multiplied by weights specific to that neuron. Each neuron outputs a score for a given class. In other words, the class score is calculated as the sum of the weighted averages of the activation maps.
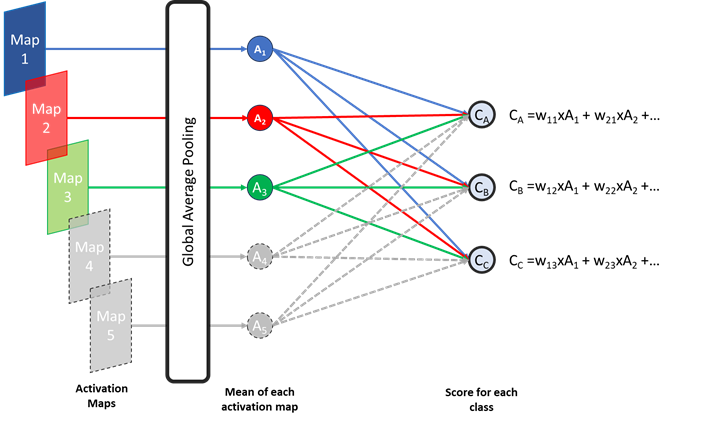
The weight assigned to each average reflects how much the corresponding activation map contributes to the classification. Optionally, a normalization step can be applied so that all class scores sum to 1. The sample is then assigned to the class with the highest score.
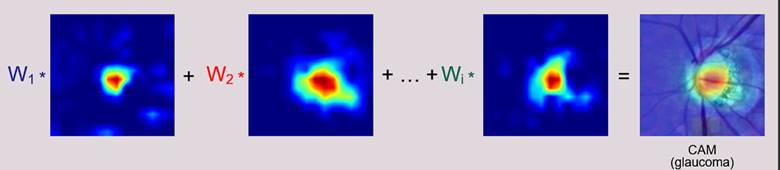
With this architecture, a high value in an activation map alone does not necessarily drive a high class score. Only areas with high values in activation maps associated high weights for the predicted class significantly contribute to the final classification.
Consequently, multiplying the activation map value by its corresponding weight can be used to the contribution of each area of an activation map to the class score. CAM is computed by performing this operation for all activation maps and then summing the contributions across maps, producing a heatmap that reflects the overall importance of each region for the predicted class. This heatmap, referred to as ‘Class Activation Maps’, can then be overlaid on top of the original image.
Medical applications
In medical imaging, Class Activation Mapping (CAM) provides valuable insights into the decision-making process of AI models, supporting both quality assessment and verification of model focus. Much like saliency maps, CAM can be used to confirm whether predictions are based on clinically relevant regions. When the highlighted areas correspond to lesions, anatomical structures, or pathological signs, confidence in the model’s reliability is strengthened.
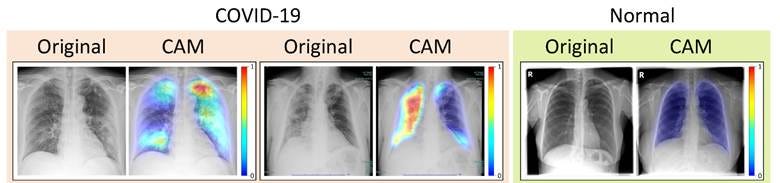
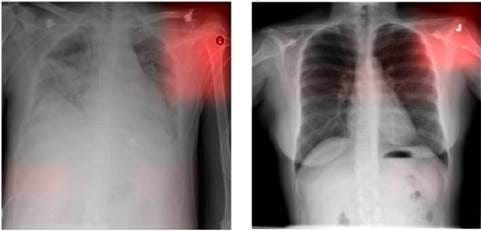
Conversely, CAM can uncover situations where a model relies on irrelevant features or artefacts that may compromise performance. For example, CAMs have revealed cases where classification decisions were influenced by metal tokens or markers present in the image rather than by the underlying pathology. Identifying such behavior is essential for error analysis, as it helps distinguish between genuine diagnostic reasoning and misleading “shortcuts.”
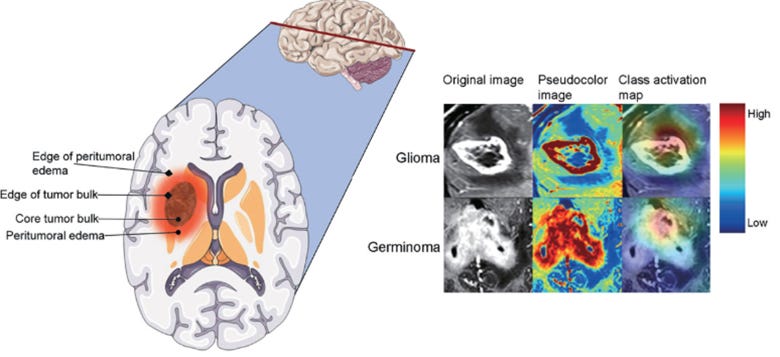
Beyond verification, CAM can provide more nuanced insights into model behavior. Fine-grained analysis may reveal differences in the regions of focus depending on the type of outcome—for instance, highlighting distinct focus patterns when classifying different tumor types. These observations can guide further research, dataset curation, and model development.
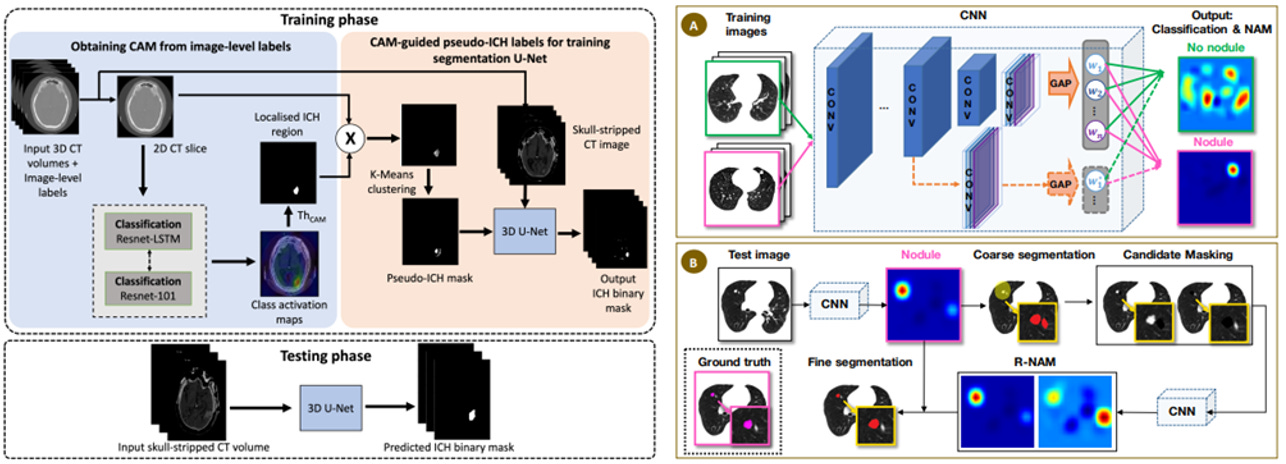
CAM is also leveraged in practical workflows that benefit from its ability to localize regions of interest. While CAM alone produces coarse maps, these can be used as a computationally efficient first step for region detection or approximate lesion segmentation. This approach has been applied in tasks such as intracranial hemorrhage detection or pulmonary nodule segmentation, where CAM-generated maps serve as an initial filter before applying more resource-intensive segmentation methods to the most relevant areas.
Pros
Produces less noisy heatmaps compared with traditional saliency maps.
Computationally efficient and can be applied post hoc, without modifying or retraining the original neural network.
Can be integrated into existing workflows to provide quick visual verification of model focus.
Cons
Only compatible with certain convolutional neural network architectures; not applicable to all state-of-the-art networks.
Provides coarse localization and may not precisely delineate fine structures.
Derived Methods and Main Alternatives
Several methods have been derived from the original Class Activation Mapping technique, including Score-CAM ([9]) and Ensemble CAM ([10]). The term “class activation map” is also sometimes used to describe outputs of other explainable AI methods.
Some of the most cited alternatives and related approaches include:
Saliency maps gradient-based visualization of pixel importance.
Grad-CAM – a gradient-based extension of CAM, applicable to a wider range of architectures ([11]).
Occlusion method – evaluates the effect of systematically masking regions of the input on model output.
Attention maps – leverage built-in attention mechanisms in neural networks to highlight important regions.
Specialized models exist for segmentation or region-of-interest identification, such as the Segment Anything Model (SAM) ([12])
References
[1] Zhou B, Khosla A, Lapedriza A, Oliva A, Torralba A. Learning Deep Features for Discriminative Localization.; 2015. https://arxiv.org/pdf/1512.04150
[2] Knipe H, Worsley C. Diverticulosis (CT colonoscopy). Radiopaediaorg. Published online 2021. doi:https://doi.org/10.53347/rid-88385
[3] Ko YC, Wey SY, Chen WT, et al. Deep learning assisted detection of glaucomatous optic neuropathy and potential designs for a generalizable model. Qiu Y, ed. PLOS ONE. 2020;15(5):e0233079. doi:https://doi.org/10.1371/journal.pone.0233079
[4] Duran-Lopez L, Dominguez-Morales JP, Corral-Jaime J, Vicente-Diaz S, Linares-Barranco A. COVID-XNet: A Custom Deep Learning System to Diagnose and Locate COVID-19 in Chest X-ray Images. Applied Sciences. 2020;10(16):5683. doi:https://doi.org/10.3390/app10165683
[5] Zech JR, Badgeley MA, Liu M, Costa AB, Titano JJ, Oermann EK. Variable generalization performance of a deep learning model to detect pneumonia in chest radiographs: A cross-sectional study. Sheikh A, ed. PLOS Medicine. 2018;15(11):e1002683. doi:https://doi.org/10.1371/journal.pmed.1002683
[6] Ye N, Yang Q, Chen Z, et al. Classification of Gliomas and Germinomas of the Basal Ganglia by Transfer Learning. Frontiers in Oncology. 2022;12. doi:https://doi.org/10.3389/fonc.2022.844197
[7] Ramananda, Shreyas H, Sundaresan V. Class Activation Map-based Weakly supervised Hemorrhage Segmentation using Resnet-LSTM in Non-Contrast Computed Tomography images. arXiv.org. Published 2023. Accessed August 29, 2025. https://arxiv.org/abs/2309.16627
[8] Feng X, Yang J, Laine AF, Angelini ED. Discriminative Localization in CNNs for Weakly-Supervised Segmentation of Pulmonary Nodules. Published online July 4, 2017:568-576. doi:https://doi.org/10.1007/978-3-319-66179-7_65
[9] Wang H, Wang Z, Du M, et al. Score-CAM: Score-Weighted Visual Explanations for Convolutional Neural Networks. arXiv:191001279 [cs]. Published online April 13, 2020. https://arxiv.org/abs/1910.01279
[10] Muhammad Aasem, Muhammad Javed Iqbal. Toward explainable AI in radiology: Ensemble-CAM for effective thoracic disease localization in chest X-ray images using weak supervised learning. Frontiers in Big Data. 2024;7. doi:https://doi.org/10.3389/fdata.2024.1366415
[11] Selvaraju RR, Cogswell M, Das A, Vedantam R, Parikh D, Batra D. Grad-CAM: Visual Explanations from Deep Networks via Gradient-based Localization. International Journal of Computer Vision. 2020;128(2):336-359. doi:https://doi.org/10.1007/s11263-019-01228-7
[12] Kirillov A, Mintun E, Ravi N, et al. Segment Anything. arXiv:230402643 [cs]. Published online April 5, 2023. https://arxiv.org/abs/2304.02643