
Explainable AI : Understanding Saliency Maps
Introducing one of the most commonly-used Explainable AI tool.

What are saliency maps ?
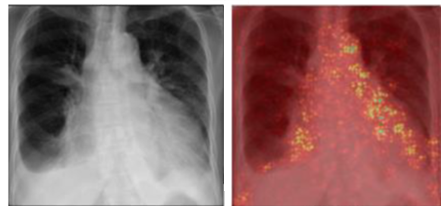
Saliency maps are a widely used method in explainable artificial intelligence (XAI), particularly in classification tasks involving image data. They highlight which pixels in the input image the model focuses on when making its prediction—indicating areas that most influence the classification outcome. This focus is quantified as a pixel-wise saliency value, reflecting the relative importance of each pixel. The resulting map is typically visualized as a heatmap, which can be overlaid on the original image to support interpretation
How are saliency maps generated ?
In the context of image classification, saliency maps are computed by evaluating how sensitive the model's output— the predicted probability of a particular class—is to changes in individual pixel values. The key idea is as follows:
- If changing a pixel has a high impact on the model’s output, the pixel has high saliency.
- If changing a pixel has little impact on the model’s output, the pixel has low saliency.
In mathematical terms, this is expressed as gradient:
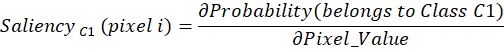
This process must be applied to each pixel in the image, resulting in a complete map of saliency values.
Importantly, saliency is classification-specific: the relevance of a given pixel may vary depending on the particular condition or pathology being assessed. For instance, a pixel might be highly salient when classifying one disease but not for another.
While saliency maps are most commonly applied to image data, the concept can be extended to other data modalities, such as time-series signals—for example, electrocardiograms (ECG)—where the importance of individual data points can be assessed.
Medical applications
In medical imaging, saliency maps offer valuable insights that enhance both the interpretability and trustworthiness of AI models. One primary application is verifying whether the model’s predictions are based on clinically relevant regions—such as lesion locations, radiological signs, or anatomical structures associated with a particular diagnosis. When the highlighted areas align with known clinical indicators, it strengthens the confidence in the model’s decision-making process.
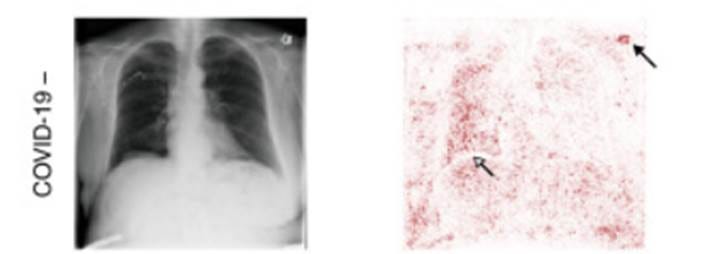
Saliency maps also play a critical role in error analysis. They can reveal situations where the model is focusing on irrelevant or misleading features, which may result in inaccurate predictions or correct outcomes for the wrong reasons. For example, a model might appear to perform well in internal validation but rely on ‘shortcuts’ such as image borders or laterality markers.
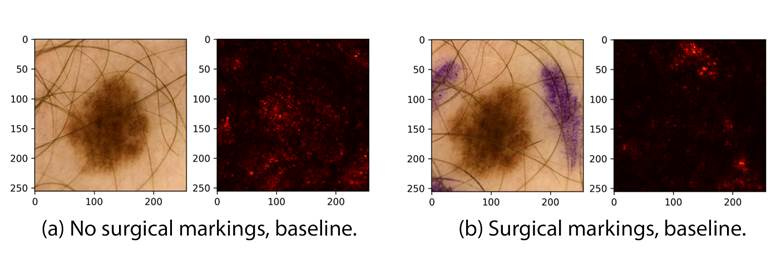
Additionally, saliency maps can help detect model sensitivity to confounding factors, domain shifts, or data artefacts. These issues often occur when a model trained in one institution performs poorly when deployed in another due to differences in imaging protocols, population characteristics. Saliency maps can highlight such vulnerabilities by revealing attention to non-diagnostic elements, such as surgical markers or rulers in dermatology images, which may inadvertently influence the model’s output.
Pros
- Can be applied post hoc; no need to modify or retrain the original neural network.
- Simple to implement and interpret
Cons
- Results can be noisy
- The heatmap does not indicate whether a pixel’s influence supports or opposes classification into a given class.
- Results may not align with clinically relevant areas
Main alternatives
Attention maps – leverage built-in attention mechanisms
Class Activation Mapping (CAM) - an early explainable AI method for Convolutional Networks
Grad-CAM – another gradient-based method that can be applied to for Convolutional Networks
Occlusion method – systematically occludes parts of the input to observe changes in the model’s output
References
[1] Lee, Kang-Hee, et al. “A Development and Validation of an AI Model for Cardiomegaly Detection in Chest X-Rays.” Applied Sciences, vol. 14, no. 17, 17 May 2025, pp. 7465–7465, www.mdpi.com/2076-3417/14/17/7465, https://doi.org/10.3390/app14177465. Accessed 17 May 2025.
[2] Chaudhari, Gunvant R., et al. “Deep Learning Augmented ECG Analysis to Identify Biomarker-Defined Myocardial Injury.” Scientific Reports, vol. 13, no. 1, 27 Feb. 2023, https://doi.org/10.1038/s41598-023-29989-9.
[3] DeGrave, Alex J, et al. AI for Radiographic COVID-19 Detection Selects Shortcuts over Signal. 14 Sept. 2020, https://doi.org/10.1101/2020.09.13.20193565.
[4] Bevan, Peter, and Amir Atapour-Abarghouei. Skin Deep Unlearning: Artefact and Instrument Debiasing in the Context of Melanoma Classification. Proceedings Of Machine Learning Research, 23 July 2022.
Huff, Daniel T, et al. “Interpretation and Visualization Techniques for Deep Learning Models in Medical Imaging.” Physics in Medicine & Biology, vol. 66, no. 4, 1 Feb. 2021, p. 04TR01, www.ncbi.nlm.nih.gov/pmc/articles/PMC8236074/, https://doi.org/10.1088/1361-6560/abcd17. Accessed 17 May 2025.